
Abstract
A planned experimental study on the production of green hydrogen by alkaline electrolysis is carried out by the Plan Composite Centered (PCC) method. The parameters studied are the concentration of the electrolyte, the distance between electrodes, the height of the electrodes, the total supply voltage of the electrolyser, temperature, and the electrolyte type. The results show that the effect of concentration, height, voltage and temperature are positive. However, the effect of the distance between the electrodes is negative. Electrolysis with potassium hydroxide (KOH) is more efficient than with sodium hydroxide (NaOH). The second-order interactions are weak, except for the voltage-temperature interaction which is significant. The results of the experimental study conducted in this work are in agreement with previous studies. Two a polynomial modeling (with KOH and with NaOH) suitable for predicting the flow of hydrogen produced are presented. Three optimizations of ascending constraints on the operating parameters to have a maximum hydrogen production and with a minimum of electrical energy and a minimum of concentration consumed are carried out.
Author Contributions
Academic Editor: Karunamoorthy Jayamoorthy, St. Joseph's College of Engineering
Checked for plagiarism: Yes
Review by: Single-blind
Copyright © 2023 Ahmed Brahmia, et al.
 This is an open-access article distributed under the terms of the Creative Commons Attribution License, which permits unrestricted use, distribution, and reproduction in any medium, provided the original author and source are credited.
Competing interests
The authors have declared that no competing interests exist.
Citation:
Introduction
Energy production across the world depends primarily on fossil fuels. This leads to contamination of the environment. An effective alternative to this serious danger is the rapid substitution of fossil fuels, carbon energy sources, by clean renewable energy sources that cause no emissions 1-3. The acceleration of the energy transition is necessary 4-7. It is the gradual transition from carbon-based, polluting energies to clean, renewable, and safe energies. These clean energies are solar, wind, geothermal, hydraulic energy, etc., which meet a series of complementary challenges: the reduction of greenhouse gas emissions; decentralization and redevelopment of infrastructure; reducing inequalities in access to energy and protecting the health of populations. But with all these advantages unfortunately renewable energies also have limitations such as the initial investment is very expensive and the intermittency. Hydrogen as an energy carrier presents itself as a promising solution. There are several sources of hydrogen production with different cleanliness and different colors. The electrolyte is one of the central factors in the electrolyser. This electrolyte must be carefully chosen to reduce the ohmic drops. For industries that need hydrogen in their production process, there is the possibility of producing hydrogen of renewable origin by electrolysis 8. The principle is to install an electrolyser on site, supplied with green electricity (solar and wind), as well as a storage unit. There are several methods and several types of hydrogen production by electrolysis. However, the yield of hydrogen production by electrolysis remains more or less low and further research on it should be carried out 9-11. The work of this article is articulated in this context.
The studies carried out on alkaline electrolysis are numerous but none of them are planned; each
author studies one parameter while keeping the others constant.
In this work a planned parametric study using the centered experimental design method is conducted. To predict the response, we have to do a model. To increase the efficiency of
hydrogen production by electrolysis, the optimal operating parameters must be identified; therefore, an optimization of these parameters is sought.
Methodology
The design of experiments method consists in establishing an experimental plan comprising the minimum number of experiments taking into account the desired results. The main advantages of this method compared to traditional methods of experimentation are as follows: reduction in the number of tests, possibility of studying the effects of a very large number of factors, detection of possible interactions between factors, determination of the results with good precision, make a reduction of the answer with a modeling and the possibility of making an optimization 12-18. The response matrix of the design of experiments is the rate of hydrogen production.
The main purpose of the Plan Composite Centered (PCC) is to mathematically model the studied responses in the form of a 2nd order polynomial equation and to optimize them. This method is also called the Box-Wilson type design which uses the response surface methodology and is used for continuous variables. The Design-Expert software 18 is used.
Plan Composite Centered
The main purpose of the Plan Composite Centered (PCC) is to mathematically model the studied responses in the form of a 2nd order polynomial equation and to optimize them. This method is also called the Box-Wilson type design which uses the response surface methodology and is used for continuous variables. The Design-Expert software 18 is used.
Total number of trials
A composite plan consists of three parts:
Trials of the two-level full factorial design (coded ∓ 1). The number of experiments
𝑁1 = 2𝑛 (with n: number of factors)
Star trials (coded ∓𝛼 ) α is the distance from the axial points to the center. The number of experiments 𝑁2 = 2𝑛 ; the distance α is calculated by the statistical method:
Trials at the center of the domain (coded 0). The number of experiments 𝑁3 this number is used to assess the reproducibility of experiments.
Choice of factors
In our study, the answer is the flow of hydrogen produced. The number of factors chosen is five: the concentration of the electrolyte in the electrolyser, the distance between the electrodes, the height of the electrode immersed in the solution, the total supply voltage, the temperature of the solution and the type of electrolytes. Therefore, the total number of experiments is Ntotal=50 experiences ((N1=32, N2=10 et N3=8). We repeated this test matrix twice, once with potassium hydroxide (KOH) electrolyte and once with sodium hydroxide (NaOH) electrolyte (50+50=100 experiences).
Factor variation interval
The variation interval of each factor is deduced on the one hand from the bibliographical study and on the other hand from the experimental constraints. The five factors and their ranges of variation are listed in Table 1:
Table 1. Factor values at different levels| Factor level | Factor level | |||
| - α | -1 | 0 | 1 | |
| A: Concentration (mol/l) | 0.31 | 1 | 1.5 | 2 |
| B: Distance between electrodes (cm) | 3.24 | 6 | 8 | 10 |
| C: Electrode height (cm) | 1.62 | 3 | 4 | 5 |
| D: Tension (V) | 3.62 | 5 | 6 | 7 |
| E: Temperature (°C) | 39.66 | 50 | 57.5 | 65 |
Experimental protocol
After we fixed the factors and the necessary experimental plan, we carried out the experimental tests to fill the two matrices (with KOH and with NaOH). Figure 1 gives a schematic representation of the experimental device. The response studied is the rate of hydrogen production. This flow rate is calculated indirectly by calculating the time (t) necessary for the production of a fixed volume of hydrogen for all the tests. Figure 2 and Figure 3 respectively represent the electrodes used and the distances between them. The hydrogen recovery tube is placed above the cathode.
Figure 1.Experimental device: (1) reservoir, (2) test tube, (3) cathode, (4) anode, (5) alligator clip, (6) voltage generator.
Figure 2.Heights of electrodes used.
Figure 3.Preparing the electrode sites.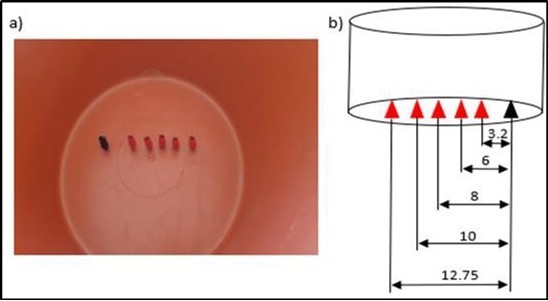
To carry out the necessary experiments, we first prepared a tank with the five distances between the electrodes (- α, -1, 0, +1 et + α) where we placed crocodile clips. Then we prepared the solutions with the requested concentrations. We heated the solution to the required temperatures. We carried out the experiments following an order where there is the minimum of the chemicals used.
Results and discussion
Filling the experience matrix
The experimental results found of the volume flow of hydrogen produced are grouped in Table 2.
Table 2. Experimental results| Number of experience | Flow rate (ml/min) | |
| with KOH | with NaOH | |
| 1 | 0.184706 | 0.09696 |
| 2 | 0,207318 | 0,105009 |
| 3 | 0,143133 | 0,090897 |
| 4 | 0,185099 | 0,095343 |
| 5 | 0,230176 | 0,066979 |
| 6 | 0,249283 | 0,105197 |
| 7 | 0,167715 | 0,088113 |
| 8 | 0,170097 | 0,101885 |
| 9 | 0,378215 | 0,199641 |
| 10 | 0,424809 | 0,219925 |
| 11 | 0,318674 | 0,168563 |
| 12 | 0,378 | 0,237727 |
| 13 | 0,433557 | 0,236798 |
| 14 | 0,449035 | 0,290276 |
| 15 | 0,338983 | 0,174474 |
| 16 | 0,350324 | 0,206058 |
| 17 | 0,188324 | 0,129803 |
| 18 | 0,239378 | 0,168919 |
| 19 | 0,179953 | 0,090897 |
| 20 | 0,200844 | 0,167827 |
| 21 | 0,254162 | 0,1344 |
| 22 | 0,319693 | 0,195599 |
| 23 | 0,167715 | 0,096656 |
| 24 | 0,343761 | 0,130736 |
| 25 | 0,402982 | 0,282765 |
Choice of model type
The mathematical model is a polynomial model according to the coded factors and applicable to the defined experimental domain. To choose the suggested model, the R² value must be on the one hand close to 1 and on the other hand it is necessary that R² and R² adjusted do not differ considerably; if not then there is a strong chance that there are insignificant terms in the model. Table 3a and Table 3b respectively give the analysis results for the choice of the suitable model for the tests with KOH and for the tests with NaOH. We note that the quadratic model is the suggested model for both types of electrolytes.
Table 3a. Choice of the suitable model (the electrolyte KOH)| Source | Sequential P-value | lack of adjustment P-value | R2 | Adjusted R2 | predicted R2 | |
| Linear | < 0.0001 | 0.0029 | 0.7772 | 0.7519 | 0.7183 | |
| 2FI | 0.9856 | 0.0014 | 0.7931 | 0.7018 | 0.6042 | |
| Quadratic | 0.0018 | 0.0061 | 0.8899 | 0.8139 | 0.5395 | Suggested |
| Cubic | 0.9661 | 0.0008 | 0.9213 | 0.7245 | -9.0284 |
| Source | Sequential P-value | lack of adjustment P-value | R2 | Adjusted R2 | predicted R2 | |
| Linear | < 0.0001 | 0.0004 | 0.8689 | 0.854 | 0.8273 | |
| 2FI | 0.728 | 0.0003 | 0.8909 | 0.8428 | 0.8167 | |
| Quadratic | <0.0001 | 0.0028 | 0.9547 | 0.9235 | 0.8161 | Suggested |
| Cubic | 0.2259 | 0.003 | 0.9827 | 0.9393 | -0.7385 |
ANOVA analysis
Table 4a and Table 4b present the ANOVA analysis of variance to judge the performance of the model obtained successively for KOH and for NaOH. Based on the ANOVA analysis, we can conclude that:
Table 4a. ANOVA analysis (the electrolyte KOH)| Source | Sum of squares | Freedom degree | Mean of Square | Ratio-F | Valeur-p Prob > F | Statistical significance |
| Model | 0.4711 | 20 | 0.0236 | 11.71 | < 0.0001 | Significant |
| A concentration | 0.0185 | 1 | 0.0185 | 9.21 | 0.005 | Significant |
| B Distance | 0.0164 | 1 | 0.0164 | 8.14 | 0.0079 | Significant |
| C Height | 0.01 | 1 | 0.01 | 4.97 | 0.0337 | Significant |
| D Voltage | 0.3569 | 1 | 0.3569 | 177.48 | < 0.0001 | Significant |
| E Temperature | 0.0097 | 1 | 0.0097 | 4.83 | 0.0362 | Not significant |
| AB | 0.0001 | 1 | 0.0001 | 0.0261 | 0.8727 | Not significant |
| AC | 0 | 1 | 0 | 0.019 | 0.8912 | Not significant |
| AD | 0.0006 | 1 | 0.0006 | 0.2832 | 0.5986 | Not significant |
| AE | 0.0016 | 1 | 0.0016 | 0.7729 | 0.3866 | Not significant |
| BC | 0.001 | 1 | 0.001 | 0.476 | 0.4957 | Not significant |
| BD | 0.0013 | 1 | 0.0013 | 0.6405 | 0.4301 | Not significant |
| BE | 0.001 | 1 | 0.001 | 0.476 | 0.4957 | Not significant |
| CD | 0.0019 | 1 | 0.0019 | 0.9482 | 0.3382 | Not significant |
| CE | 0.0008 | 1 | 0.0008 | 0.4129 | 0.5255 | Significant |
| DE | 0.0003 | 1 | 0.0003 | 0.1344 | 0.7166 | Not significant |
| A2 | 0.002 | 1 | 0.002 | 1 | 0.3252 | Significant |
| B2 | 428 | 1 | 428 | 21.3 | <0.0001 | Not significant |
| C2 | 0.0114 | 1 | 0.0114 | 0.9152 | 0.3467 | Significant |
| D2 | 0.0018 | 1 | 0.0018 | 5.67 | 0.024 | Significant |
| E2 | 0.0064 | 1 | 0.0064 | 3.17 | 0.0856 | Not significant |
| Source | Sum of Squares | Freedom degree | Mean of squares | Ratio-F | Valeur-p Prob > F | Statastical Significance |
| Model | 0.3493 | 20 | 0.0175 | 30.56 | < 0.0001 | Significant |
| A concentration | 0.0245 | 1 | 0.0245 | 42.91 | < 0.0001 | Significant |
| B Distance | 0.0114 | 1 | 0.0114 | 20 | 0.0001 | Significant |
| C Height | 0.0003 | 1 | 0.0003 | 0.4439 | 0.5105 | Not significant |
| D Voltage | 0.2479 | 1 | 0.2479 | 433.84 | < 0.0001 | Significant |
| E Temperature | 0.0338 | 1 | 0.0338 | 59.07 | < 0.0001 | Significant |
| AB | 0.0002 | 1 | 0.0002 | 0.3327 | 0.5685 | Not significant |
| AC | 0.0001 | 1 | 0.0001 | 0.2102 | 0.65 | Not significant |
| AD | 0.0007 | 1 | 0.0007 | 1.17 | 0.2892 | Not significant |
| AE | 0.0015 | 1 | 0.0015 | 2.6 | 0.1178 | Not significant |
| BC | 0.001 | 1 | 0.001 | 1.77 | 0.1935 | Not significant |
| BD | 0.0008 | 1 | 0.0008 | 1.4 | 0.2463 | Not significant |
| BE | 0.0005 | 1 | 0.0005 | 0.896 | 0.3517 | Not significant |
| CD | 0.0004 | 1 | 0.0004 | 0.686 | 0.4143 | Not significant |
| CE | 0.0001 | 1 | 0.0001 | 0.1479 | 0.7034 | Not significant |
| DE | 0.0028 | 1 | 0.0028 | 4.92 | 0.0345 | Significant |
| A2 | 0.0001 | 1 | 0.0001 | 0.1182 | 0.7335 | Not significant |
| B2 | 0.0012 | 1 | 0.0012 | 2.01 | 0.1666 | Not significant |
| C2 | 0.0001 | 1 | 0.0001 | 0.1379 | 0.7131 | Not significant |
| D2 | 0.0154 | 1 | 0.0154 | 26.99 | < 0.0001 | Significant |
| E2 | 0.0101 | 1 | 0.0101 | 17.66 | 0.0002 | Significant |
The two models (for KOH and for NaOH) are validated by the Fischer test.
The significant parameters if the electrolyte is KOH are A, B, C, D, E, 𝐵2 and 𝐷2
The significant parameters if the electrolyte is NaOH are A, B, D, E, DE, 𝐷2and 𝐸2
Effects and Interactions
The effects and interactions on the response are grouped in Table 5a and Table 5b.
Table 5a. Effects and Interactions of factors (KOH)| Effects | Interactions | Quadratic effects | |||
| x0 | 0.2249 | x12 | 0.0013 | x11 | 0.006 |
| x1 | 0.0207 | x13 | -0.0011 | x22 | 0.0278 |
| x2 | -0.0194 | x14 | -0.0042 | x33 | 0.0058 |
| x3 | 0.0152 | x15 | 0.007 | x44 | 0.0143 |
| x4 | 0.0908 | x23 | -0.0055 | x55 | 0.0107 |
| x5 | 0.015 | x24 | -0.0063 | ||
| x25 | 0.0055 | ||||
| x34 | -0.0077 | ||||
| x35 | 0.0051 | ||||
| x45 | -0.0029 | ||||
| Effects | Interactions | Quadratic effects | |||
| x0 | 0.1556 | x12 | 0.0024 | x11 | 0.0011 |
| x1 | 0.0238 | x13 | 0.0019 | x22 | 0.0045 |
| x2 | -0.0162 | x14 | 0.0046 | x33 | 0.0012 |
| x3 | 0.0024 | x15 | 0.0068 | x44 | 0.0167 |
| x4 | 0.0757 | x23 | -0.0056 | x55 | 0.0135 |
| x5 | 0.0279 | x24 | -0.005 | ||
| x25 | -0.004 | ||||
| x34 | 0.0035 | ||||
| x35 | -0.0016 | ||||
| x45 | 0.0094 | ||||
The histograms of figure 4a and figure 4b give a comparison between the different effects and interactions respectively with the electrolyte KOH and NaOH.
Figure 4a.Histogram of comparison between the different effects and interactions (with KOH)
From the ANOVA analysis, we can note that:
Concentration has a positive and significant effect regardless of the electrolyte used. This shows that if the concentration of the electrolyte increases the flow rate increases. This is explained by the fact that if the concentration increases then the charge transfer increases. These results are in agreement with the results of Fatima ezzahra Chakik et al 19, who studied the effect of electrolyte concentration on hydrogen production. They used a solution of NaOH with different concentrations, and they found that as long as the concentration matters so much the production.
The distance between the electrodes has a negative and significant effect for both types of electrolytes. That is, if the distance between the electrodes increases then the hydrogen production rate decreases. Indeed, increasing the distance between the electrodes increases the path traveled by the charges, so it limits the production speed. N. Nagai et al 20 have shown that if the space between the electrodes increases then the electrical resistance increases and the efficiency of electrolysis decreases.
The supply voltage has a positive effect and is the most important parameter regardless of the electrolyte used (which is noticeable in Figures 4-a and 4-b). Dayana D'arc of Fatima Palhares et al 21 found that if the tension increases the production also increases. The same result is found by Kenji Kikuchi et al 22
The operating temperature has a positive and significant effect whatever the electrolyte used. Yangyang Li et al 23, Boissonneau et al 24 and Damien le Bideau 25 studied the effect of temperature on the efficiency of electrolysis, and they found that if the temperature increases then the production increase. Yangyang Li et al 26experimentally studied the effect of temperature and pressure under different current densities, they found that if the operating temperature increases the voltage required, for the same amount of hydrogen production, decreases. We can explain this by the fact that increasing the operating temperature increases the activity of the catalyst.
The height of the electrodes has a positive and significant effect if the electrolyte is KOH. If the electrolyte is NaOH, the effect of the height of the electrodes is also positive but not significant.
From our results, we can notice very clearly that electrolysis with KOH is more efficient than electrolysis with NaOH. As long as the diameter of the electrolyte is large as long as the transfer is faster. These results are in good agreement with the results of M. Hassen sellami et al 27. Who experimentally studied the effect of the nature of the electrolyte on the volume of hydrogen produced. We can increase the efficiency of electrolysis by using KOH (since it is more efficient) not in pure water but in another solution (for example water from the air conditioning system or wastewater) 28. This shows that the number of valence electrons in the electrolyte has an important effect, and the application of a magnetic field can promote the transfer 29. The concern that: in a stoichiometric approach, it takes 9 kg of water to produce 1 kg of hydrogen; however, after taking into consideration the inefficiencies of the process the water consumption amounts to 18-24 kg per kg of hydrogen 30-31; will no longer be the case, especially if wastewater is used in the electrolyser 32.
According to the ANOVA analysis, we notice that no interaction of order 2 is significant with the KOH electrolyte. The only significant interaction found is DE (voltage-temperature) with the electrolyte NaOH. Figure 5 gives a representation of the response surfaces of these interactions with the NaOH electrolyte. For five factors we have ten interactions of order 2 (AB, AC, AD, AE, BC, BD, BE, CD, CE, DE).
Figure 5.Response surfaces of combined effects (ten Interactions)
Modelization
The equation in terms of coded factors can be used to make predictions about rethink for given levels of each factor. By default, higher levels of factors are coded as +1 and lower levels are coded as -1. The coded equation is useful for determining the relative impact of factors by comparing factor coefficients.
Complete model
The quadratic complete model used is given by the following equation:
𝑞 = 𝑥0 + 𝑥1 𝐴 + 𝑥2 𝐵 + 𝑥3 𝐶 + 𝑥4 𝐷 + 𝑥5 𝐸 + 𝑥12 𝐴𝐵 + 𝑥13 𝐴𝐶 + 𝑥14 𝐴𝐷 + 𝑥15 𝐴𝐸
+ 𝑥23 𝐵𝐶 + 𝑥24 𝐵𝐷 + 𝑥25 𝐵𝐸 + 𝑥34 𝐶𝐷 + 𝑥35 𝐶𝐸 + 𝑥45 𝐷𝐸 + 𝑥11 𝐴2
+ 𝑥22 𝐵2 + 𝑥33 𝐶2 + 𝑥44 𝐷2 + 𝑥55 𝐸2
with:
𝑥0, 𝑥1, 𝑥2, 𝑥3, 𝑥4, 𝑥5 : average effects of variables respectively A, B, C, D, E.
𝑥12, 𝑥13, 𝑥14, 𝑥15, 𝑥23, 𝑥24, 𝑥25, 𝑥34, 𝑥35, 𝑥45 : effect of variable interactions.
𝑥11, 𝑥22, 𝑥33, 𝑥44, 𝑥55 : quadratic effects of variables.
Reduced model
We can improve the complete model by eliminating insignificant factors from the complete model and we obtain a so-called reduced model.
if the electrolyte is KOH the reduced model is:
𝑞 = 0.2249 + 0.0207 𝐴 − 0.0194 𝐵 + 0.0152 𝐶 + 0.0908 𝐷 + 0.0150 𝐸 + 0.0278 𝐵2
+ 0.0143 𝐷2
if the electrolyte is NaOH the reduced model is:
𝑞 = 0.1556 + 0.0238 𝐴 − 0.0162 𝐵 + 0.0757 𝐷 + 0.0279 𝐸 + 0.0094 𝐷𝐸 + 0.0167 𝐷2
+ 0.0107 𝐸2
Model adequacy
To study the adequacy of the found model, we draw the curve which represents the values given by the model according to the experimental values. Figure 5-a and Figure 5-b respectively show the adequacy of the model if the electrolyte is KOH and if the electrolyte is NaOH.
Figure 5a.Volume flow predicted as a function of volume flow actual (KOH)
Figure 5b.Volume flow predicted as a function of volume flow actual (NaOH)
Optimization
Optimization seeks a combination of factor levels that simultaneously meet the established criteria for a best desired response. Table 6 represents the objectives, the importance of each objective and the results.
Table 6. Result of different optimizations| Objective | Importance | Results | ||
| Optimization 1 | A : Concentration (mol/l) | - | - | 2 |
| B : Distance between electrodes | - | - | 6 | |
| (cm) | ||||
| C : Height (cm) | - | - | 5 | |
| D : Voltage (V) | - | - | 7 | |
| E : Temperature (°C) | - | - | 65 | |
| Hydrogen flow rate (ml/min) | Maximize | 5 | 0.372 | |
| Optimization 2 | A : Concentration (mol/l) | - | - | 2 |
| B : Distance between electrodes | - | - | 6 | |
| (cm) | ||||
| C : Height (cm) | - | - | 4.99 | |
| D : Voltage (V) | Minimize | 2 | 6.167 | |
| E : Temperature (°C) | - | - | 65 | |
| Hydrogen flow rate (ml/min) | Maximize | 5 | 0.274 | |
| Optimization 3 | A : Concentration (mol/l) | Minimize | 2 | 1 |
| B : Distance between electrodes | - | - | 6 | |
| (cm) | ||||
| C : Height (cm) | - | - | 5 | |
| D : Voltage (V) | Minimize | 2 | 6.262 | |
| E : Temperature (°C) | - | - | 65 | |
| Hydrogen flow rate (ml/min) | Maximize | 5 | 0.229 |
In this study three optimizations are carried out:
Optimization 1: The objective in this optimization is to maximize hydrogen production independently of other parameters. That is, to maximize the hydrogen production rate and the other parameters are random.
Optimization 2: In this optimization we will keep the same objective as the first optimization, and we add the condition to minimize the supply voltage of the electrolyser.
Optimization 3: n this optimization we will keep the same objective as the first optimization, and we add the condition to minimize the supply voltage of the electrolyzer and the condition to also minimize the concentration of the electrolyte.
Three optimizations of ascending constraints on the operating parameters to have a maximum hydrogen production are carried out. We notice that if we increase the constraints on the optimized parameters the value of the response (Hydrogen flow rate) decreases.
Conclusion
A planned experimental study on the production of green hydrogen by alkaline electrolysis is carried out by the Centered Composite Plan (PCC) method. The parameters studied are the concentration, the distance between electrodes, the height, the voltage, the temperature, and the type of electrolytes. The results show that the effect of the concentration, the height of the electrodes, the total voltage and the temperature are positive whatever the type of electrolyte. So, increasing these parameters increases hydrogen production. However, the effect of the distance between the electrodes is negative, so an increase in this distance leads to a decrease in the production of hydrogen. The interactions between the different parameters are weak and the only significant interaction is the voltage-temperature interaction. The experimental study conducted in this work gives a good agreement with previous studies. Two models (with KOH and with NaOH) suitable for predicting the flow of hydrogen produced are presented. Three optimizations of ascending constraints on the operating parameters to have a maximum hydrogen production are carried out.
Acknowledgments
no conflict of interest
References
- 2.Evans Simon, Pidcock Roz, Yeo Sophie. (2017) The social cost of carbon,”. , Carbon Brief, February 14.
- 3.Steven K Rose, Delavane B Diaz, Geoffrey J Blanford. (2017) Understanding the Social Cost of Carbon: A Model Diagnostic and Inter-Comparison Study;. , Climate Change Economics 8, 10-1142.
- 4.Suo Jiang Zhang. (2021) Celebrating the 5th year of Green Energy. , Environment (GEE), Green Energy & Environment 6, 1-2.
- 5.Jiang Suo. (2019) Zhang, Green energy environment Sustainable development. , Green Energy & Environment 26, 1-2.
- 6.Vijay Laxmi Kalyani. (2015) Manisha Kumari Dudy, Shikha Pareek, GREEN ENERGY: The NEED of the WORLD. , Journal of Management Engineering and Information Technology (JMEIT) 2, 2394-8124.
- 7.AnkicaKovač MatejParanos, DoriaMarciuš. (2021) Hydrogen in energy transition: A review”. , International Journal of Hydrogen Energy 46, 10016-10035.
- 8.Zina Meddeb, Hajjem H, Mabrouk A, Hajjaji N, Hajji N et al. (2017) process and analyses of hydrogen production from atmospheric pollutant;. https://doi.org/10.1016/j.ijhdene.2016.06.126 , International Journal of Hydrogen Energy; 42(13), 8602-86010.
- 9.Yu Z, Duan Y, Feng X, Yu X, Gao M et al. (2021) . Clean and Affordable Hydrogen Fuel from Alkaline Water Splitting: Past, Recent Progress, and Future Prospects », Adv. Mater 33, 2007100.
- 10.Zina Meddeb, Hajjem H, Mabrouk H, M R Jeday. (2015) A New Industriel Hydrogen Production Process;. https://doi.org/10.4236/gsc.2015.54018 , Green and Sustainable Chemistry 15, 145-153.
- 11.Zina Meddeb, Hajjem H, Mabrouk H, M R Jeday. (2015) A New Industriel Hydrogen Production Process;. https://doi.org/10.4236/gsc.2015.54018 , Green and Sustainable Chemistry 15, 145-153.
- 12.BOUMAHRAT A GOURDIN et M. (1989) Méthodes Numériques Appliquées. Technique et Documentation -Lavoisier. , Paris
- 13.KAFAROV V. (1974) Méthodes cybernétiques et Technologie Chimique. Technique soviétique. Edition Mir. , Moscou
- 16.CETAMA M NEUILLY et. (1993) Modélisation et estimation des erreurs de mesure. Technique et Documentation Lavoisier; Londres. , New York. Paris
- 18.Bessadok-Jemai Zina Meddeb A. (2009) Ammar Ben Brahim; Modelling Heat Transfer with Phase Change Phenomena in a Spirally Finned Exchanger/Evaporator;. https://doi: 10.3303/CET0917093 , Chemical Engineering Transactions; 17, 517-527.
- 19.F ezzahra Chakik, Kaddami M, et M Mikou. (2017) Effect of operating parameters on hydrogen production by electrolysis of water ». , Int. J. Hydrog. Energy 42, 2555025557.
- 20.Nagai N. (2003) Existence of optimum space between electrodes on hydrogen production by water electrolysis ». , Int. J. Hydrog. Energy 28, 3541.
- 21.Palhares D D de Fátima, Vieira L G M, Damasceno et J J R. (2018) Hydrogen production by a low-cost electrolyzer developed through the combination of alkaline water electrolysis and solar energy use ». , Int. J. Hydrog. Energy 43, 42654275.
- 22.Kikuchi Kenji. (2001) Hiroko Takeda, Beatrice Rabolt, Takuji Okaya, Zempachi Ogumi, Yasuhiro Saihara, Hiroyuki Noguchi, Hydrogen particles and supersaturation in alkaline water from an Alkali–Ion–Water electrolyzer. , Journal of Electroanalytical Chemistry 506, 10-1016.
- 23.Yangyang Li a.Study the effect of lye flow rate, temperature, system pressure and different current density on energy consumption in catalyst test and 500W commercial alkaline water electrolysis ». 22, 2022-10.
- 24.Byrne P Boissonneau et P. (2000) An experimental investigation of bubble-induced free convection in a small electrochemical cell ». , J. Appl. Electrochem 30, 767775.
- 25.D L Bideau. (2021) Étude de l’amélioration de la production d’hydrogène par le procédé d’électrolyse de l’eau alcaline simulation avec mécanique des fluides numérique et optimisation génétique », phdthesis, Université de Bretagne Sud. 03321259.
- 26.Yangyang Li a.Study the effect of lye flow rate, temperature, system pressure and different current density on energy consumption in catalyst test and 500W commercial alkaline water electrolysis ». 22, 2022-10.
- 27.Loudiyi M H Sellami et K.Electrolytes behavior during hydrogen production by solar energy ». , Renew. Sustain. Energy Rev 70, 13311335-2017.
- 28.I N Aquigeh, M Z Ayissi, et D Bitondo. (2021) Multiphysical Models for Hydrogen Production Using NaOH and Stainless-Steel Electrodes in Alkaline Electrolysis Cell ». , J. Combust vol, 111.
- 29.Liu Meng-Meng, Zhang Zhen.Liang-Ming Pan, The effect of foam electrodes on hydrogen production efficiency during water electrolysis in the magnetic field. The Proceedings of the International Conference on Nuclear Engineering https://doi.org/10.1299/jsmeicone.2019.27.1580 .
- 30.Delpuech Aïda. (2022) À qui profite la stratégie tunisienne pour l’hydrogène vert ? ©petrmalinak/Shutterstock, octobre.